WMCycleData: A quick intro
Forgive my writing style, this is my first blog post :)
Birmingham has an interesting history with cycling. Once a cycling metropolis it now lives up to its motor city fame. While cycling is generally quite hostile in the city, progress has started on improving infrastructure and encouraging modal shift. Our crown jewel is the A38 Cycle Way, a fully segregated cycling route which takes you from Selly Oak to almost the centre of the city. Blessed with the name the ‘Blue Route’ this cycle lane represents the best Birmingham has currently to offer and so is celebrated by many.
Build it and they will come, a sentence often muttered by active travel campaigners arguing the importance of infrastructure to encourage active travel. Without a safe network of cycling infrastructure, many will not feel safe cycling and so will opt for cars. The reverse is also true, build safe infrastructure and many will ditch their car for a more pleasant alternative. And the best part, we have the data to back this up.
Birmingham and the wider West Midlands Combined Authority have been recording high-frequency traffic counts for a few years now. These rely on AI cameras, placed high on lamp posts, which categorise and count traffic which passes through their field of view. The cameras are quite smart and can do quite a bit more such as near-miss detection and route modelling. Originally for the A38 cycleway, this data was exposed to the public via a roadside sign, updating throughout the day to display the total journeys that day. Upon learning of an API for this data, and working with Martin from @A38Cycleway, we set out to produce and publish daily graphs logging the journeys in and out of town. To produce these graphics, we query the API, parse the data to retrieve hourly and daily counts and finally use headless chromium to screenshot a local web page.
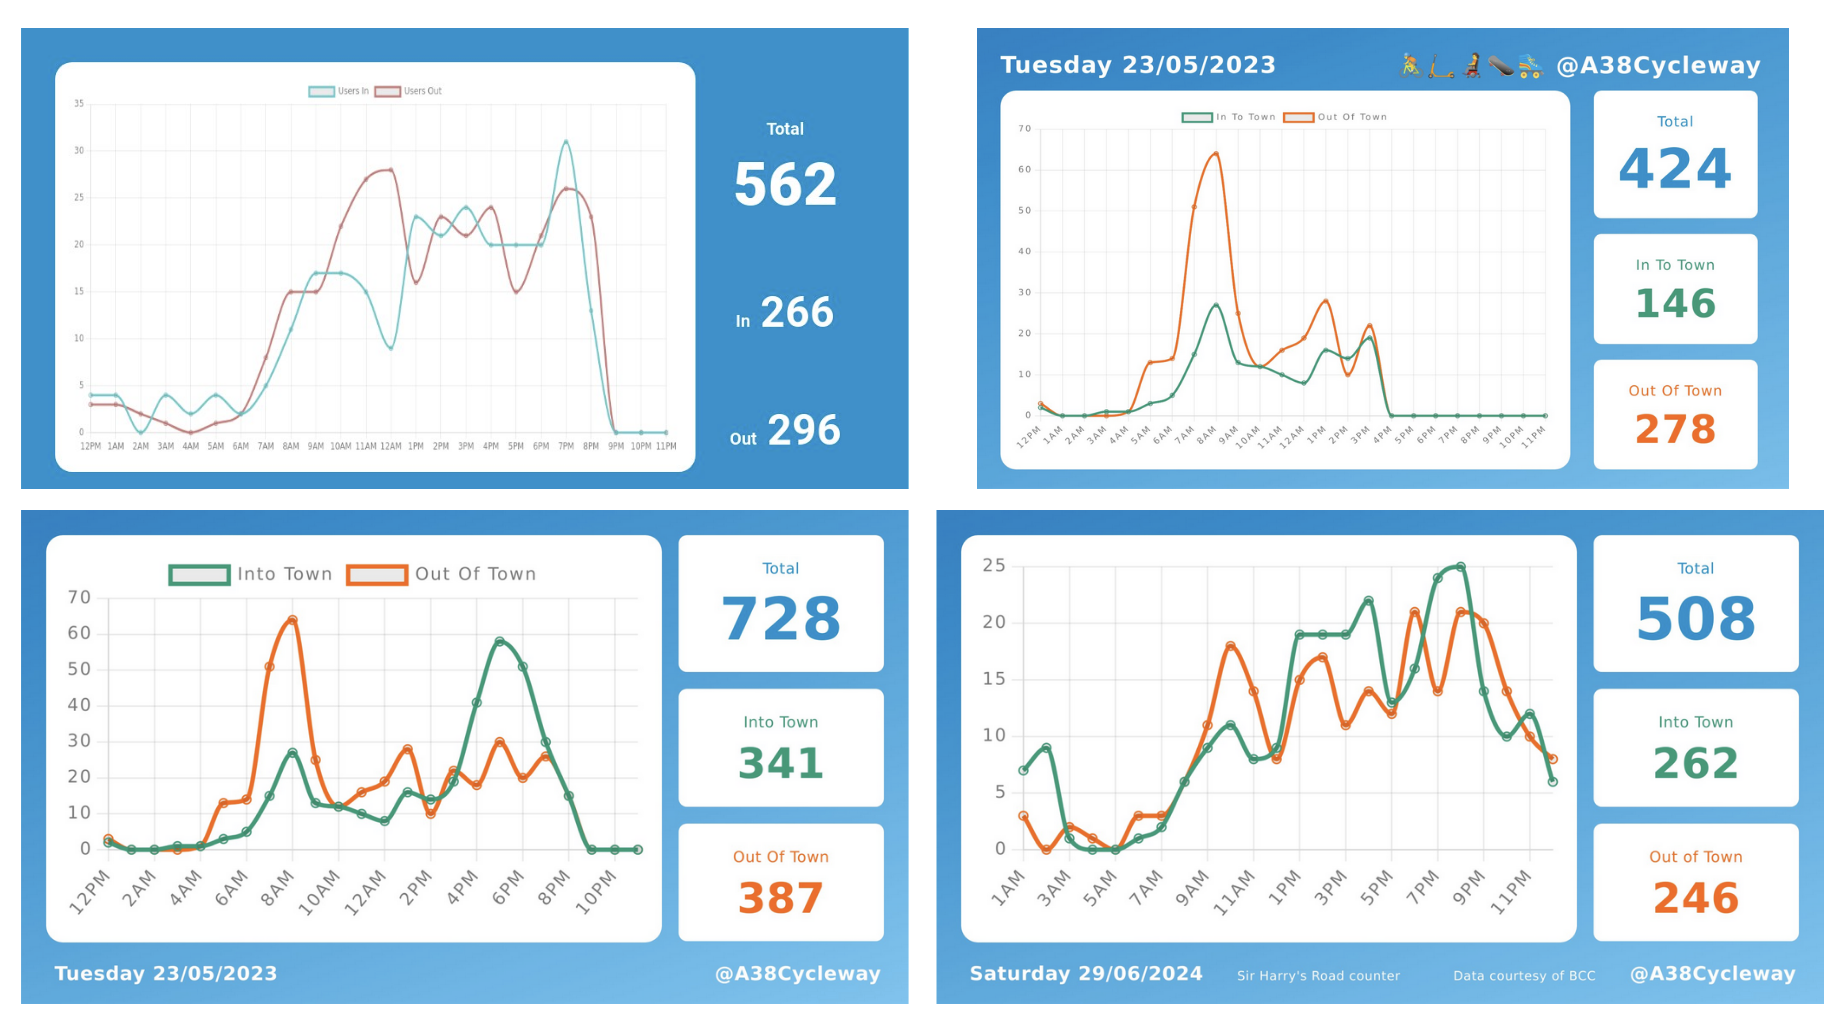 Design iterations of the A38 Twitter Bot Graphic
With the A38 Twitter Bot as its origin, WMCycleData.com was developed. The key goals of this tool were, one to log and store traffic data to allow access to historic counts and two provide a set of interactive tools to understand and visualise the trends across the city both temporally and geographically.
Data
When WMCycleData was being developed, the WMCA API was fairly limited, providing 5-minute chunk counts with about a limit of two weeks. For this reason, it was decided to query and store data from this API, into a more flexible backend. TimescaleDB, an extension onto of Postgress, was chosen as the database of choice due to its ability to handle time-series data and SQL-like requests. A new API was built using FastAPI, allowing flexible and open querying of the data. Every 30 minutes the WMCA API is queried for the last 4 hours of data and stored into our DB. We use timescales continuous aggregation to build an hourly results table for efficient querying and purge the 5-minute data after two weeks.
Front End
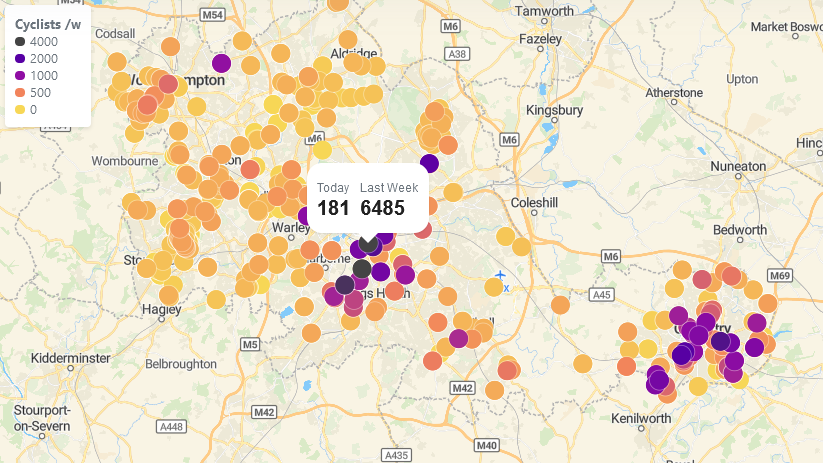
As mentioned before, the goal of WMCycleData is to help visualise cycling, but also wider traffic, trends with respect to both location and time. To represent the geographical trends, we plot the weekly counts on a map of the region. For efficient loading, these are cached every time the DB is updated. To show temporal trends, we graph daily flow, weekly averages and a week-by-week overview. Each of these graphs is interactive and can be customised by the user.
The Trends
As with all data, the raw numbers don’t present the full picture and winder context is important. Despite this we can still observe several trends from the data. First, the cycle lanes are popular. When we filter all of the counters and only look at the most frequented routes we can see that these will more often than not fall on cycle lanes.
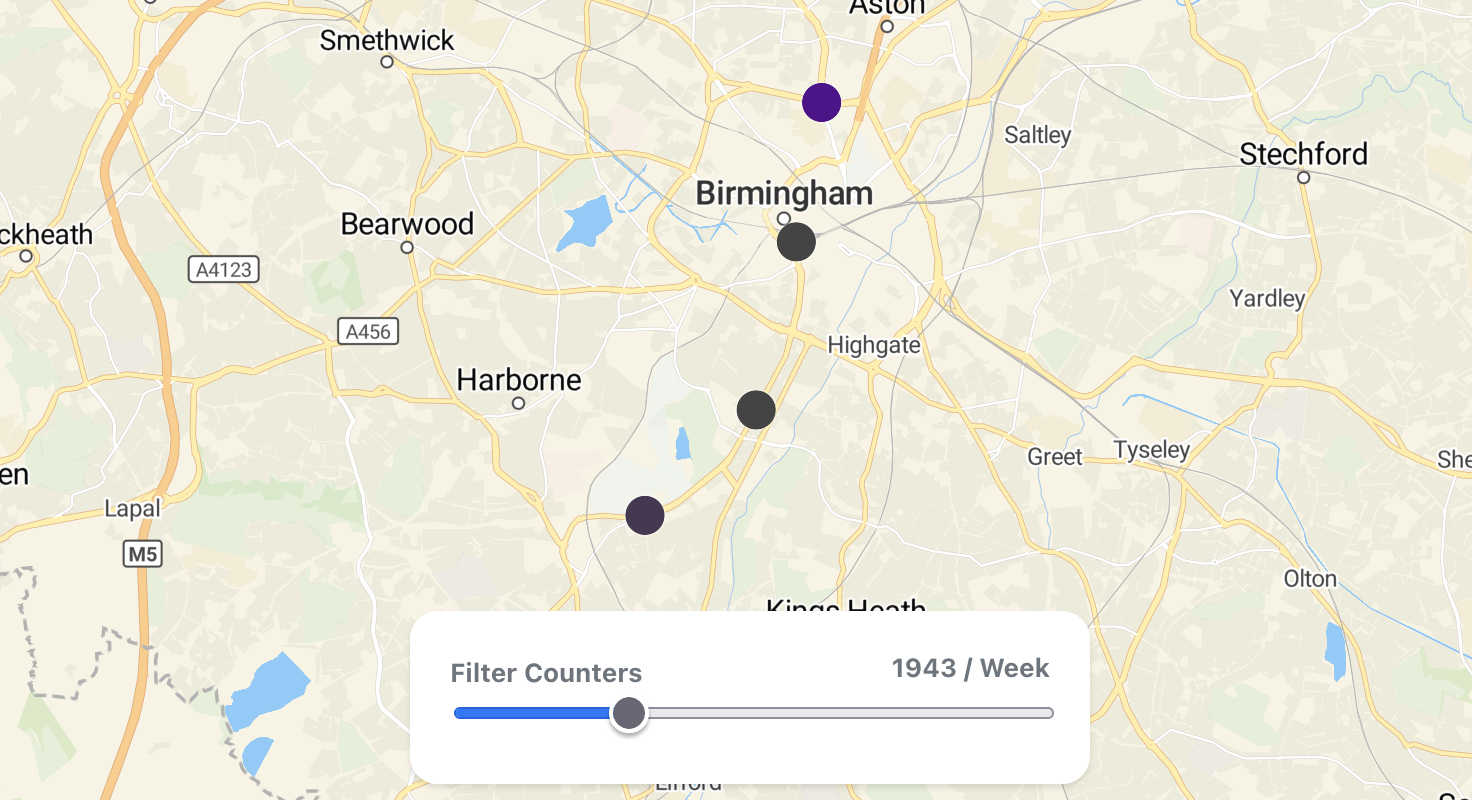 Filtering the top 5 counters in the WM, all 5 fall on cycle lanes and 4 of them fall on the A38 route
A myth we can bust with this data is that no-one cycles in the rain. Looking at the A38 data we can see slight seasonal shifts but these are far from drastic. Another trend we observe is the seasonal shift is far less severe on cycle lanes compared to regular unprotected roads, suggesting users feel safer on protected cycle lanes.
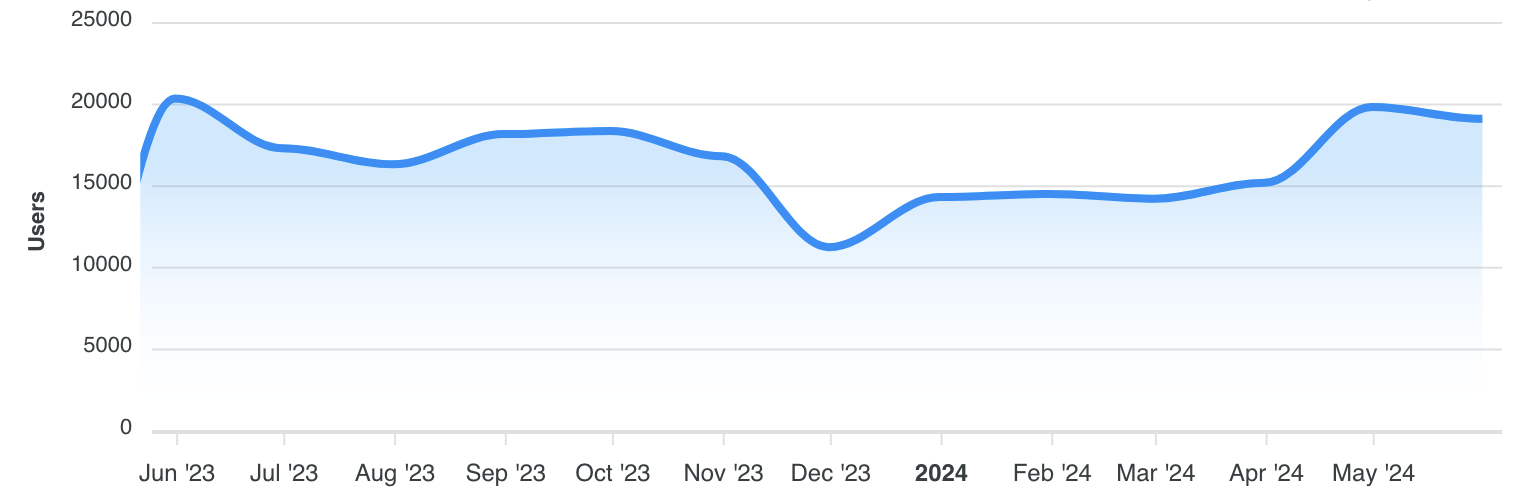 Montly counts from the A38 Sir Harrys Road Counter
Notes and Thoughts
WMCycleData is over a year old now and has been running smoothly without much intervention from me. As will all things, there are changes I plan to make, but for the most part, the tool serves its purpose. Since creating WMCycleData other tools have come along to serve a similar purpose such as the wonderful Cyclotron by Chris Woods. This tool prompted the improvement of the WMCA API and made the WMCycleData API somewhat redundant, however, I plan to keep it around to act as an archive and open source for the data. I am always seeking to improve the usefulness of the tool so if you have any ideas or features you would like, don’t hesitate to let me know.
Conclusion
Overall, I am quite happy with this project. Since building it, it has been chugging along with minimal downtime and has a very small but steady user base. We even have other projects using the API. In reality, this data can only tell us so much and we need larger year-on-year datasets to observe more informative trends. I look forward to observing the effects of new infrastructure across the city and how this can be seen in the data.